Web Application
SaaS Analytics Platform
Support tickets down because the product finally explains itself.
Industry
SaaS
Timeline
14 weeks
Package
Premium
The challenge
The platform was powerful but opaque. New users churned in the first week because they could not find the reports they came for, and the support team spent most of its time answering the same handful of navigation questions.
The solution
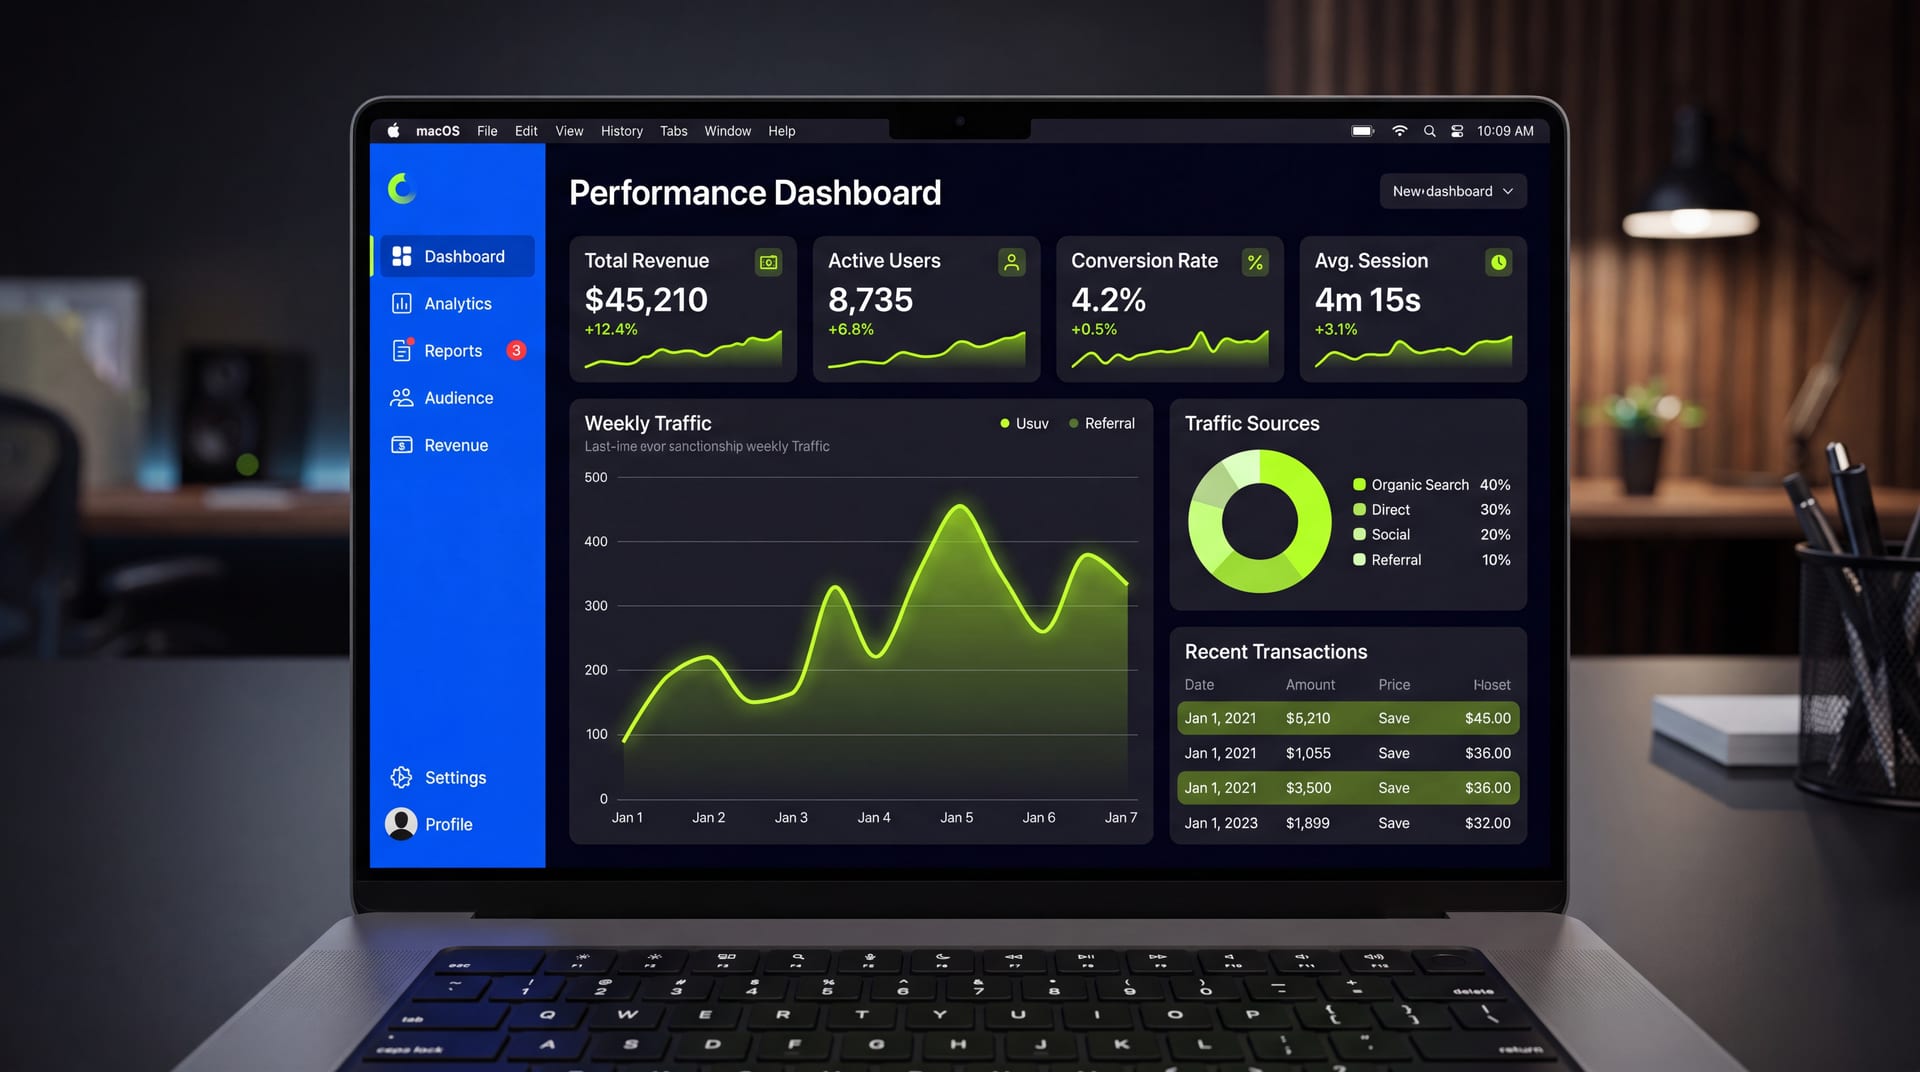
We redesigned the dashboard around the three tasks users actually performed first, added an in-context onboarding path, and rewrote the empty states so a blank screen told people what to do next. Every core report became reachable in two clicks.
The outcome
Support tickets dropped 40 percent in the first quarter after rollout. First-week activation climbed, and the support team shifted its saved time toward proactive account outreach.
What was delivered
We thought we had a support problem. Turned out we had a clarity problem, and they fixed the right one.
Priya M.
VP of Product · Cadence Analytics
Start a project
Want results like these?
Tell us about your project and we'll set up a 15-minute call to see if it's a fit.
Start a conversation →